$ gksudo /opt/structure
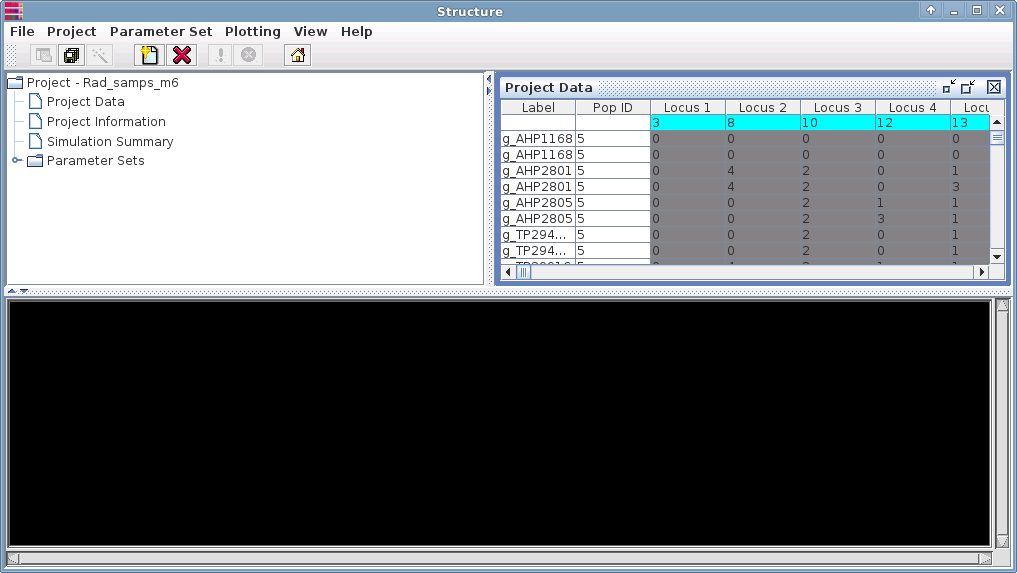
You will get a prompt for your password. The main Structure interface will appear: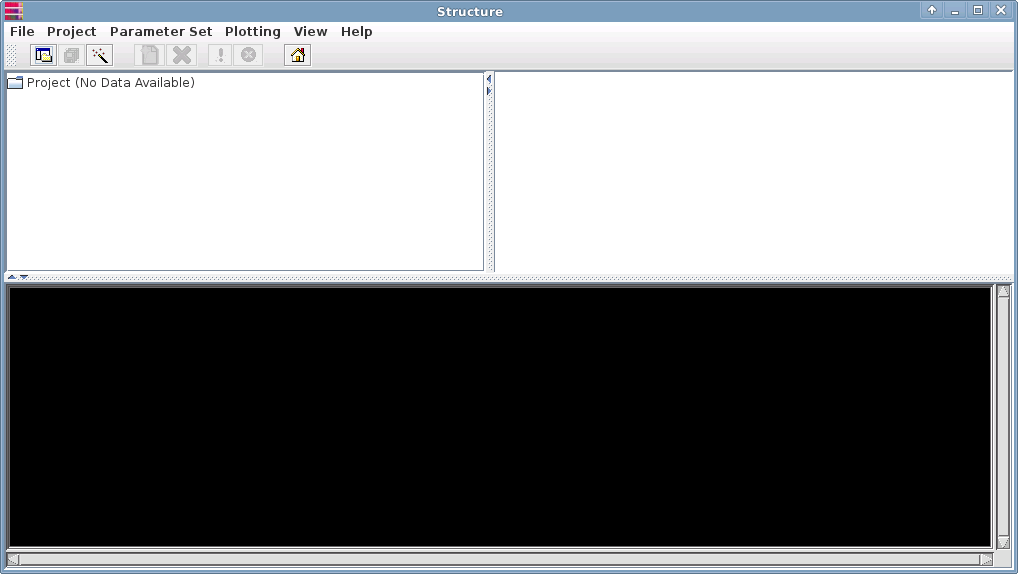
    The 'populations' output data will be written to the ./stack directory as 'batch_1.structure.tsv'.
    (for details about using the Stacks 'populations' program click here).

    The beginning of the file will look like this:# Stacks v0.9999;  Structure v2.3; November 03, 2012
		2	5	7	13	14	15	17	18	19	25	30
1	1	41	42	43	46	50	51	52	53	54	55	56    But, Structure 2.3.4 July 2012 cannot read this file properly. Edit the file by deleting the entire first row and the
    first tabs in the second row. Make sure there are no blank rows at the top of the file.

    The beginning of the file should now resemble this:                2	 5	7	13	14	15	17	18	19	25	30
1       1       41	42	43	46	50	51	52	53	54	55	56
        NOTE: Structure has a 11 character taxon name limit. Structure will truncate names to 11.
    If your taxon names are longer than 11, run a search and replace on your 'populations' batch_1.structure.tsv output file
    and make sure none of the new names are identical.
    To run Structure and Distruct, I recommend the step-by-step instructions on the Bodega phylo Structure wiki website.
    Structure needs to be started as admin so that it can read/write to your directories. The program has a symbolic link in /opt, so ...:    $ gksudo /opt/structure    You will get a prompt for your password.
    The main Structure interface will appear:
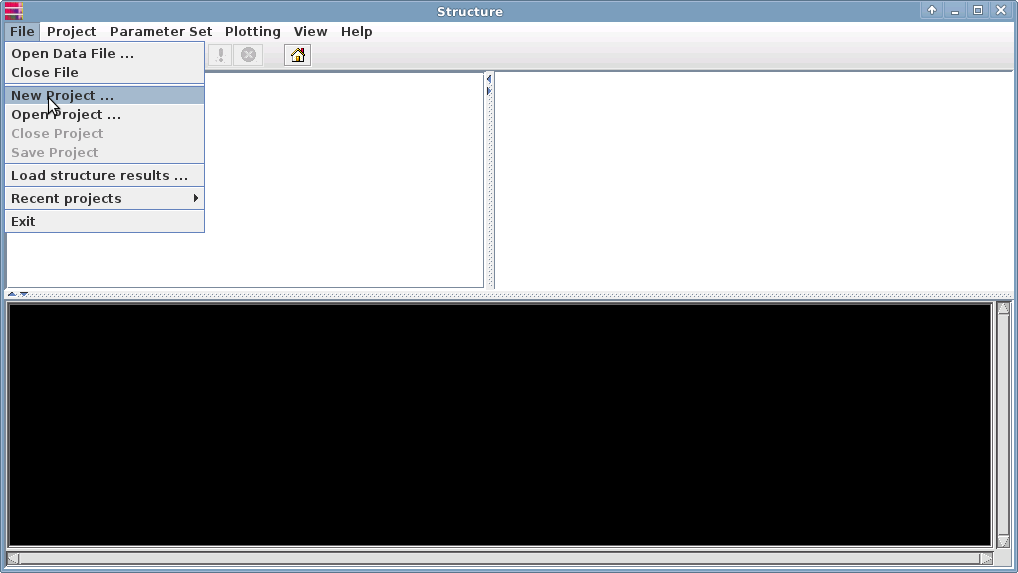
Under the File menu, select "New project":
Window 1 of 4: make teh project name informative about the parameters you used in 'populations'
 This will launch 4 consecutive windows where you enter data about your project:
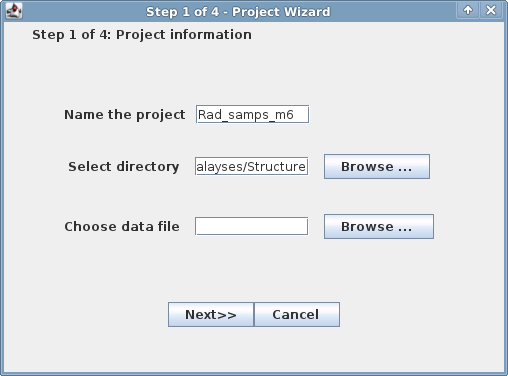 make sure to give the project a name that is unique and will distinguish it form other analyses.
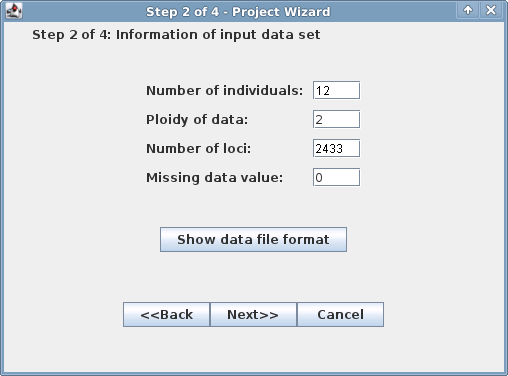
For the second window, you need to know how many individuals are included in the analysis, the ploidy level, the number of loci,
and enter "0" (zero) for missing data value. By clicking on the "Show data file format" button you will get a window that
summarizes your data (image on right). Enter the smaller numer as the number of loci (72552 in this example).
make sure to give the project a name that is unique and will distinguish it form other analyses.
For the second window, you need to know how many individuals are included in the analysis, the ploidy level, the number of loci,
and enter "0" (zero) for missing data value. By clicking on the "Show data file format" button you will get a window that
summarizes your data (image on right). Enter the smaller numer as the number of loci (72552 in this example).
 | Data file format info window: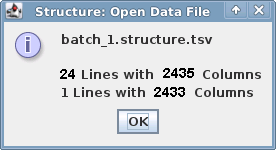 |
Step 3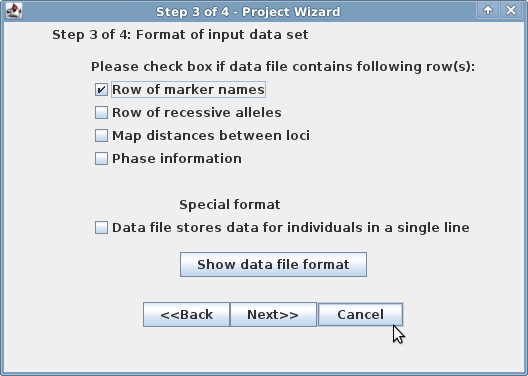 | Step 4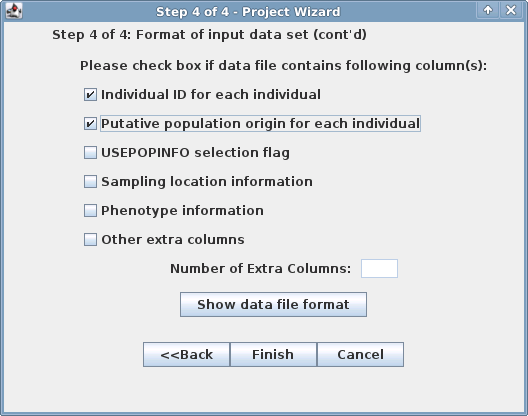 |
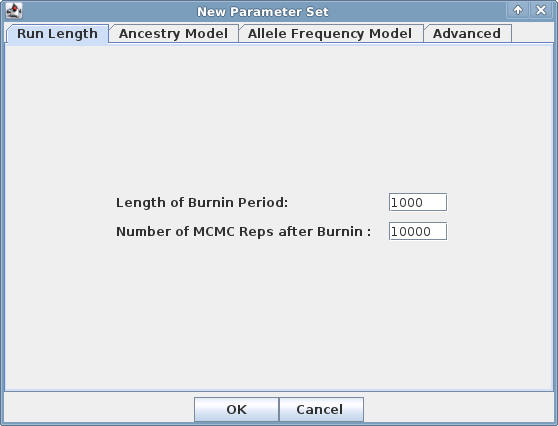
    Under the Parameter Set menu, select "New".


    A window with four tabs will be presented. Each tab has a set of parameters that can be selected. Be sure to check each tab
    to make sure the settings match your objectives:
Under the Project menu, select "Start a job".
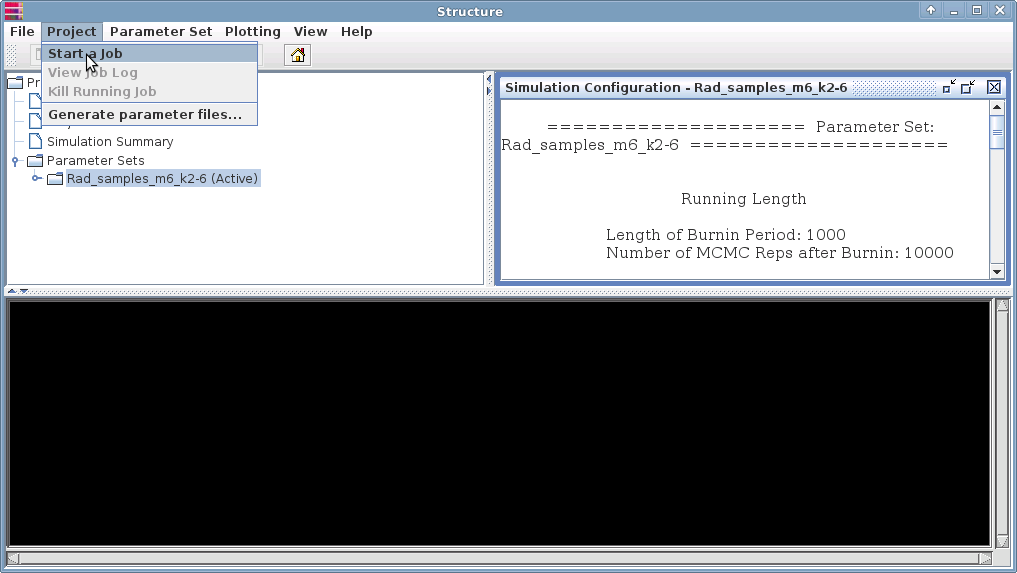 A window will appear with a list of named parameter sets:
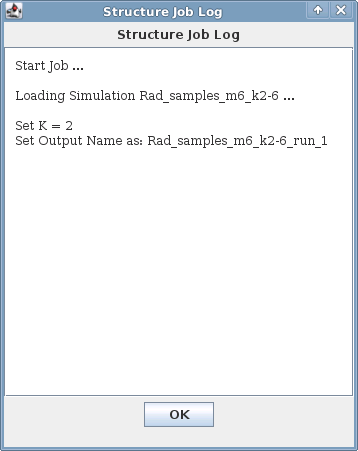
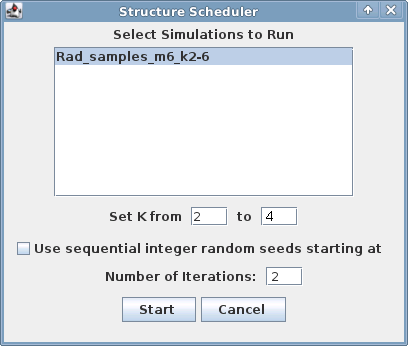 Fill in the fields and click the "Start" button.
You will get a window summarizing your analysis - Select "OK":
Fill in the fields and click the "Start" button.
You will get a window summarizing your analysis - Select "OK":
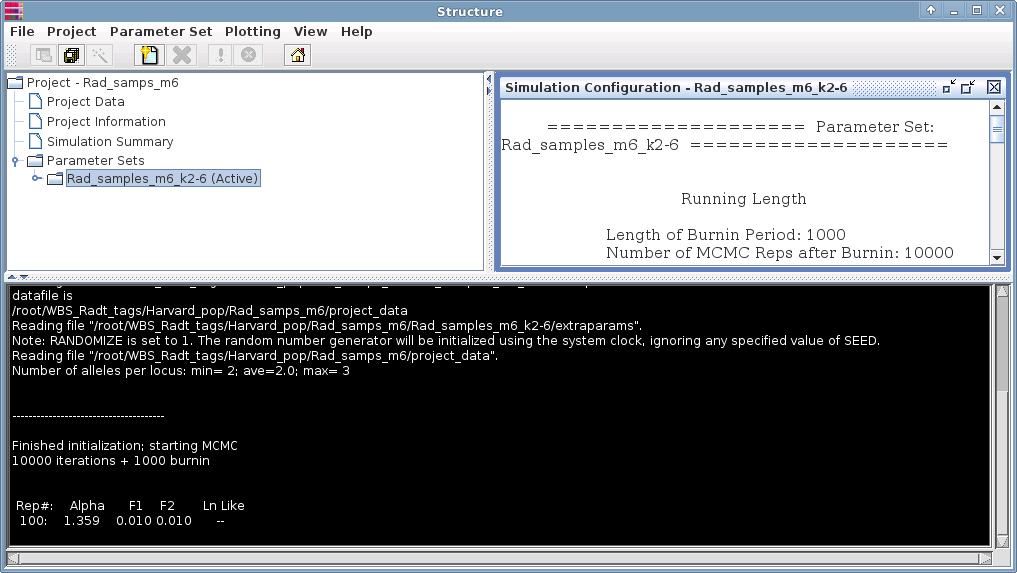
 Your analysis will begin and you can monitor the progress of the analysis in the termial panel (white text against black):